P7 is open source and cross-platform library for high-speed sending telemetry & trace data from your application with minimal usage of CPU and memory. Library contains exhaustive documentation inside package.
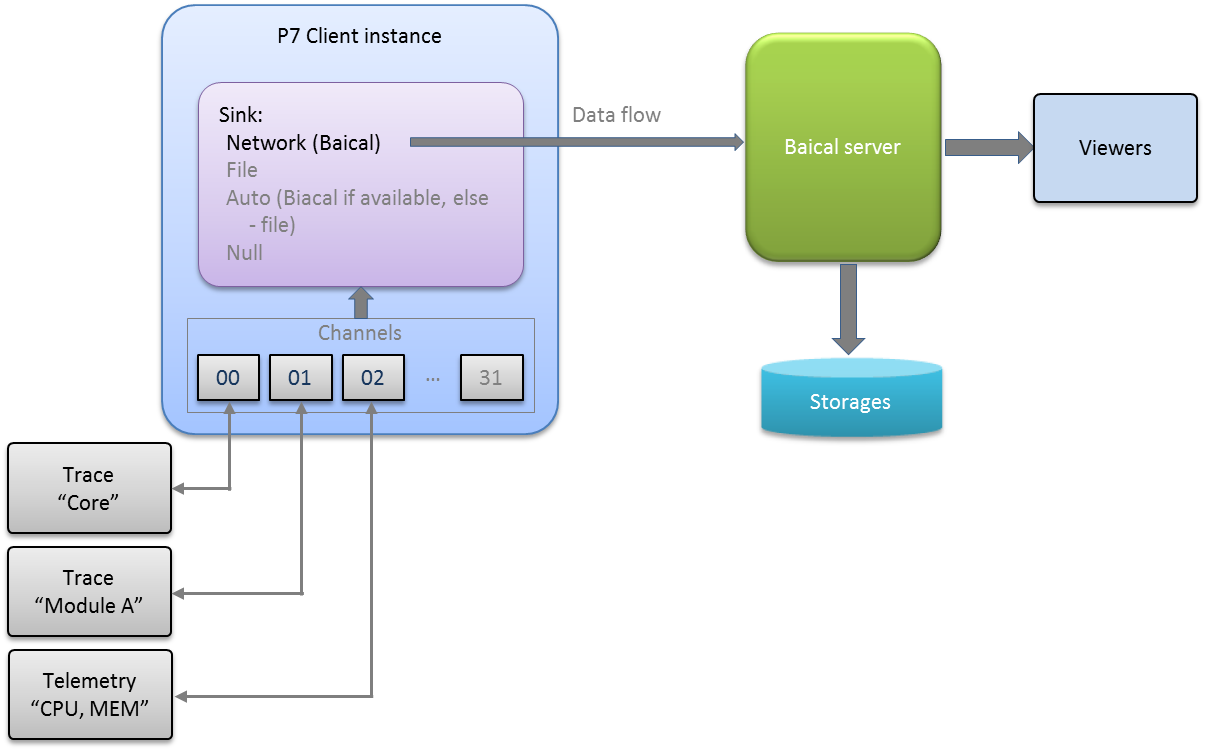
Internally P7 has very simple design, and consist of few sub-modules:
Let’s take an example (diagram below) - developed application has to write 2 independent log (trace) streams and 1 telemetry stream, and delivers them directly to Baical. Initialization sequence will be:

From software engineer’s point of view trace is a source code line (function with variable arguments list):
...
P7_TRACE(0, TM("Test trace message #%d"), 0);
...
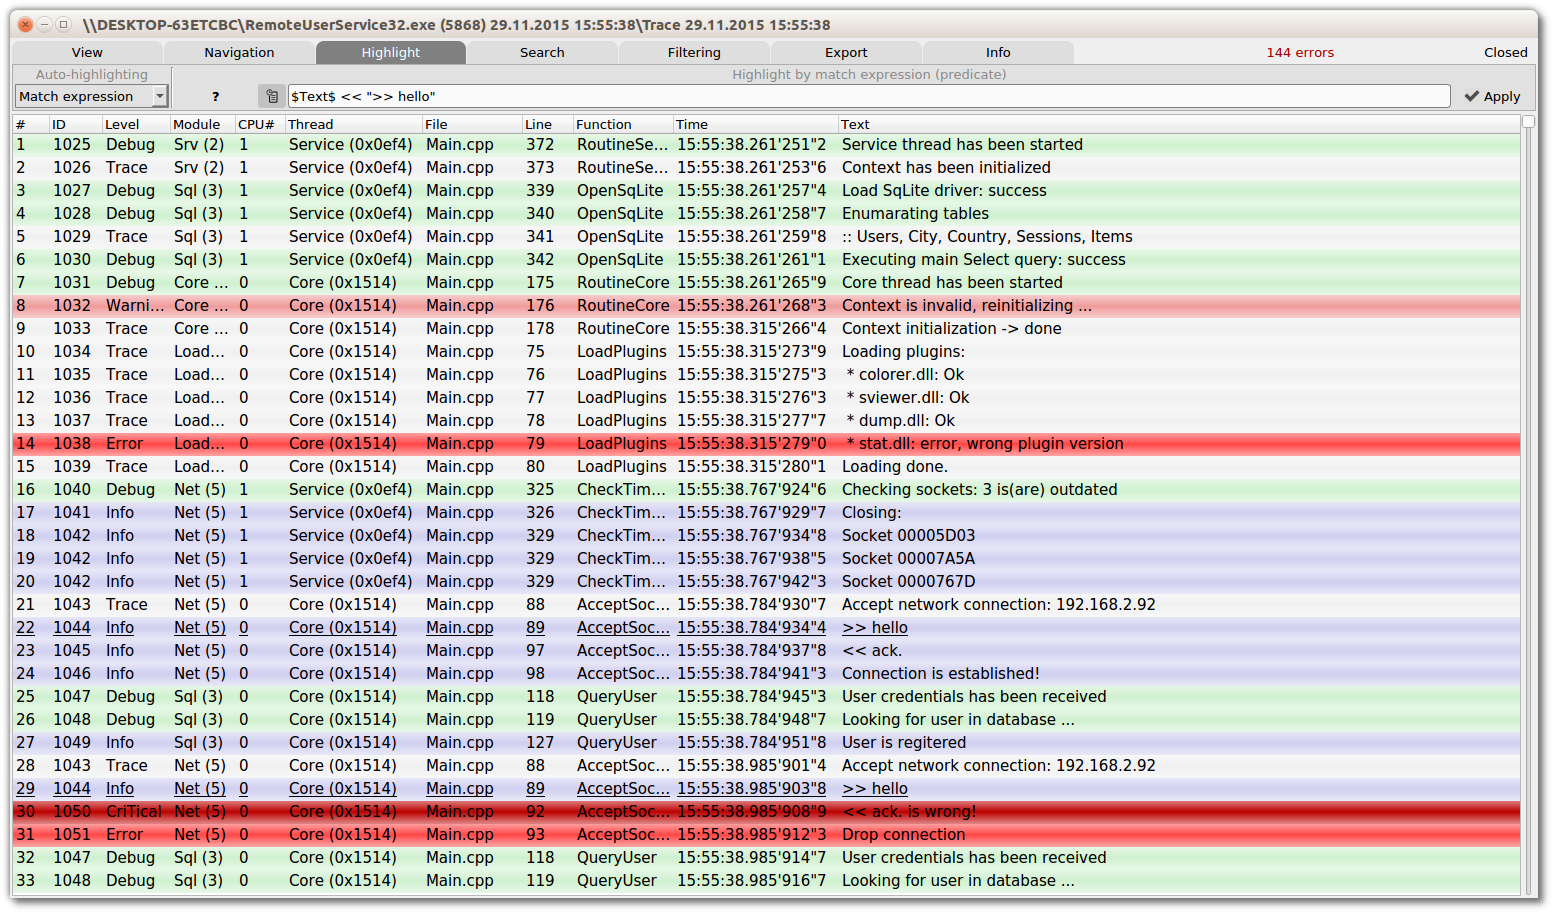
And at another side it looks like that:

It is very similar to logging, but unlike logging - trace gives your much more freedom, you don’t have to choose which information to write, you may write everything (without impacting on application performance, 50K traces per second with 0.5% CPU for example, for details see Speed test chapter in documentation) and then during debugging session use flexible filtering engine to find interesting parts, in this case you will be sure that all necessary information is available for you.
This approach became possible due to P7 performance. Trace module was designed with the idea of performance, especially on small embedded system.
To be able to send so much information next optimizations are used:
N.B.: The best performance is provided by C++ and C interfaces (release build), C# & Python wrappers provides less performing solutions.
From software engineer’s point of view telemetry is a few source code lines:
IP7_Client    hClient    = P7_Create_Client(TM("/P7.Sink=Baical /P7.Addr=127.0.0.1"));
IP7_Telemetry hTelemetry = P7_Create_Telemetry(hClient, TM(("AppStatistics"));
tUINT16       wCpuId     = 0;
tUINT16       wMemId     = 0;
tINT64        llCPU      = 0;
tINT64        llMem      = 0;

hTelemetry->Create(TM("System/CPU"), 0, 100, 90, 1, &wCpuId);
hTelemetry->Create(TM("System/Mem(mb)"), 0, 500, 450, 1, &wMemId);

while (/* ... */)
{
    //query in cycle qurrent CPU & mem values ...
    //llCPU = Get_CPU_Utilization();
    //llMem = Get_Mem_Utilization();

    //deliver info
    pTelemetry->Add(wCpuId, llCPU);
    pTelemetry->Add(wMemId, llMem);

    //do something ...
}
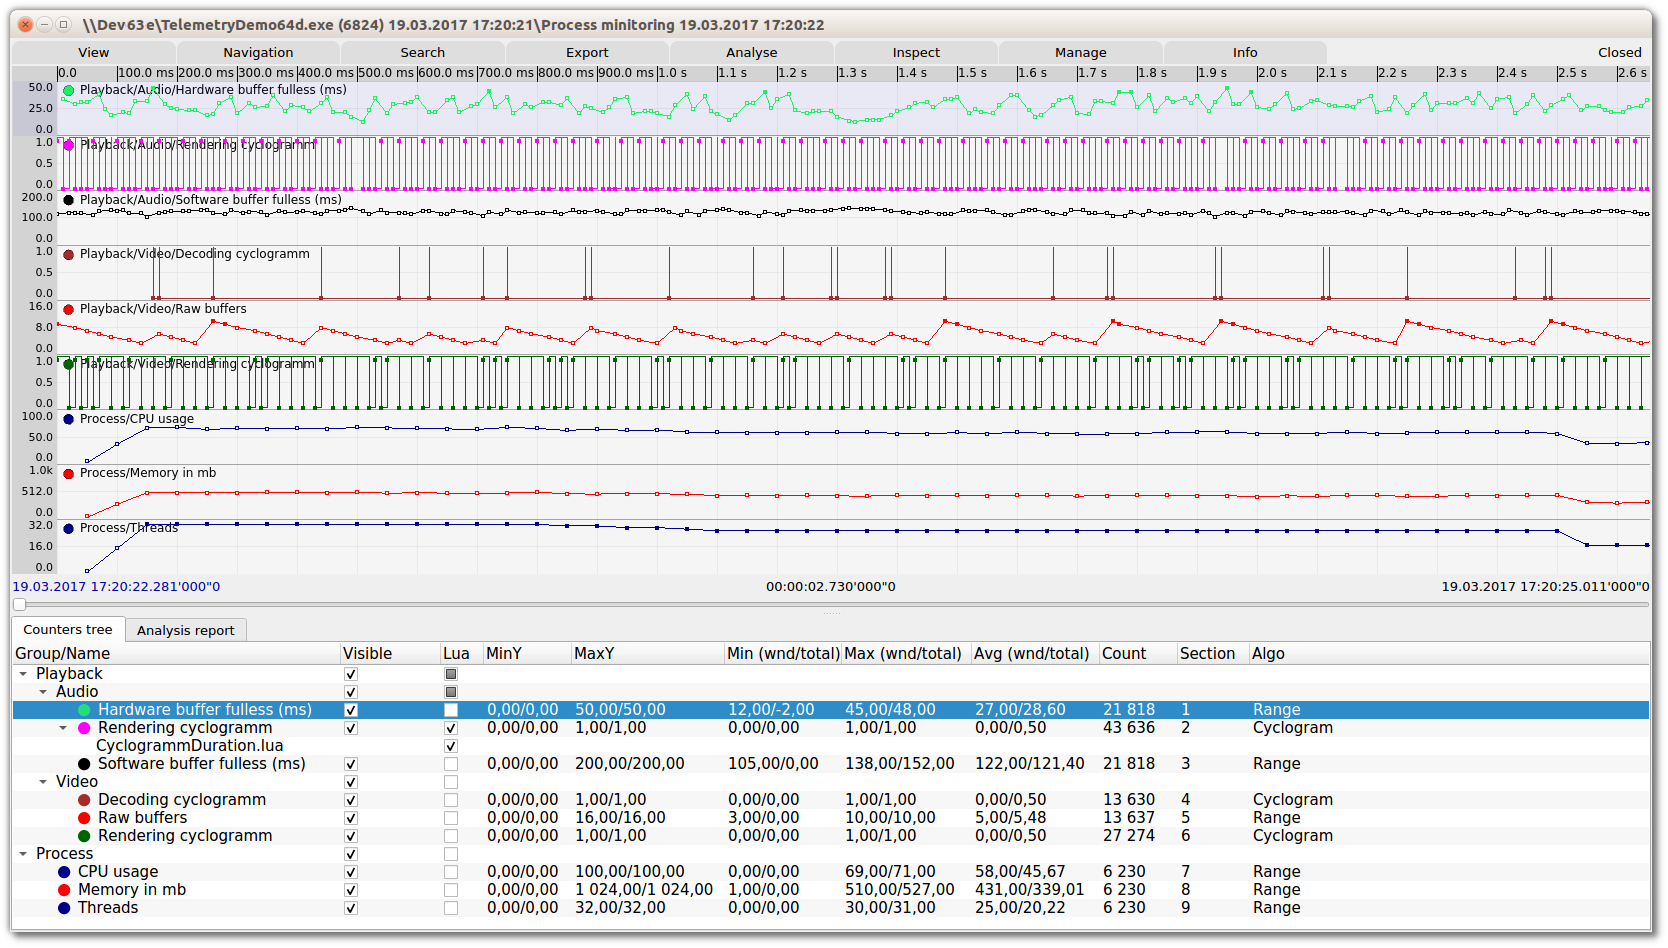
And at another side it may looks like that (thread cyclograms, buffers sizes, delays, handles count, etc.):

Telemetry is a simple and fast way to record any dynamically changed values for further or real time analysis on Baical server side. You may use it for a lot of things: system statistics (cpu, memory, hdd, etc.), buffers filling, threads cyclograms or synchronization, mutexes, networks delays, packets sizes, etc. There are plenty of possible usage cases.
Some facts about telemetry:
N.B.: The best performance is provided by C++ and C interfaces (release build), C# & Python wrappers provides less performing solutions.
contact@baical.net